


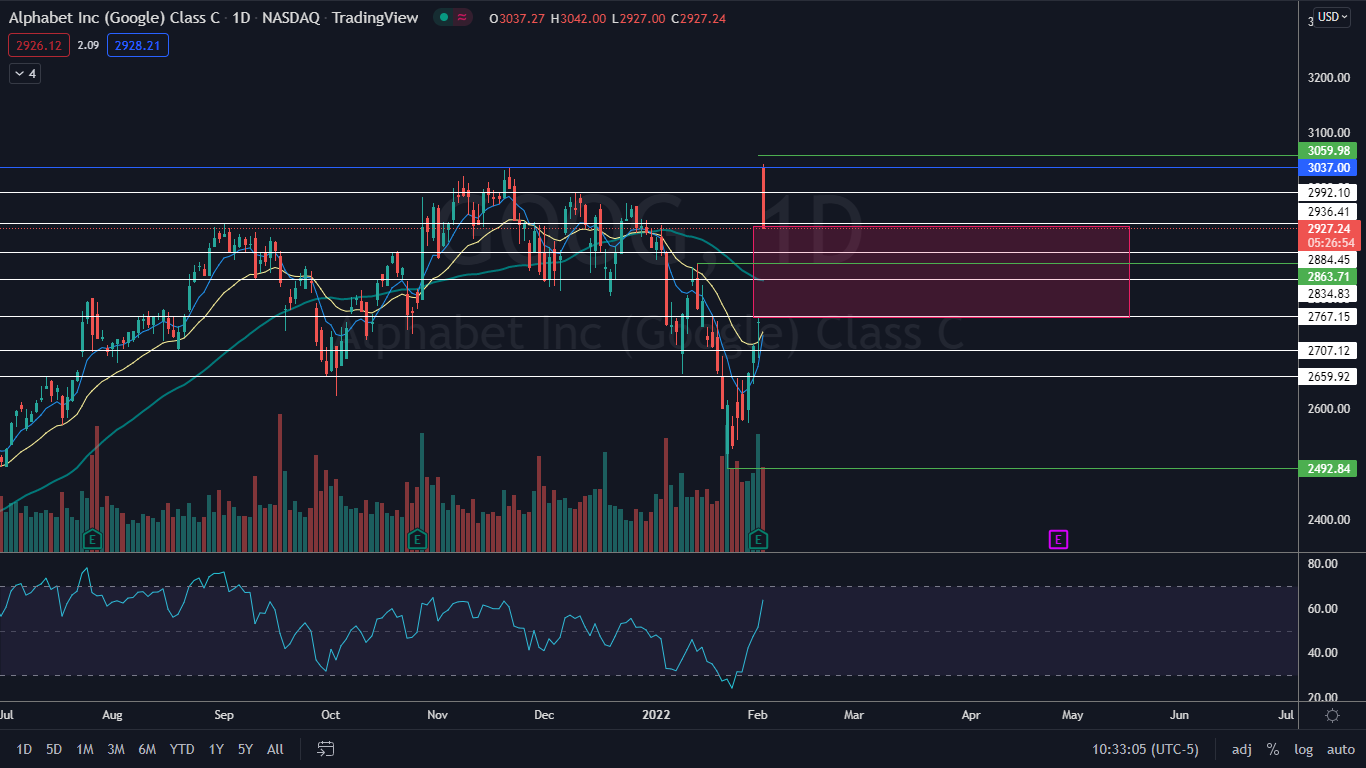
Alphabet, Inc GOOG GOOGL soared 10% higher in the premarket on Wednesday to reach a new all-time high of $3,059.98 but when the market opened the stock ran into a group of sellers and profit takers, who knocked it down about 3.5% off the open.
The selling dropped Alphabet down below its previous Nov. 19 all-time high of $3,037, which will now act as a resistance zone. If Alphabet is not able to clear the zone and trade up into blue-skies after a short period of consolidation, this will cause the stock to print a bearish double top pattern at the level.
When Alphabet printed its fourth-quarter earnings on Tuesday after the closing bell, the company released important news --that it was planning a 20-1 stock split, which, if approved, will take effect on July 1. The news could potentially cause Alphabet to ignore some longer-term bearish patterns as that date nears.
Last year, Apple, Inc AAPL and Tesla, Inc TSLA announced stock splits and if they serve as an example of what may happen to Alphabet, a big run-up into the event may be on the horizon.
On Aug. 11, 2020 when Tesla announced a 5-1 stock split, it was trading at $1,373. From that date until the split came into effect on Aug. 31, Tesla soared up 84% higher and is currently trading 236% higher than when the announcement was made.
Apple ran about 40% higher from when it announced a 4-1 stock split on July 30, 2020, the split took effect on Aug. 31 of that year, and the stock is currently trading about 81% higher than the date of the original announcement.
See Also: Are Google Q4 Results A 'Good Indication' On What's Coming With Facebook Earnings?
The Alphabet Chart (GOOG): The massive gap up higher on Alphabet gave the first indication the long downtrend may be over because it caused the stock to print a higher high above the most recent lower high at $2,863.71. Google had been trading in a consistent downtrend since reaching its previous all-time high.
The large gap below may steer bullish traders not already in a position away from Alphabet because gaps on charts fill about 90% of the time. The gap falls between $2,764 and $2,947.36 and if the stock were to fill that area, it would represent about a 6% move to the downside.
Although Alphabet has now printed a higher high, it will eventually need to print a higher low on the daily chart, above the Jan. 24 low-of-day, in order to confirm its uptrend. Bullish traders may watch for a reversal candlestick to print such as a doji or hammer to confirm the higher low is in.
Alphabet is trading above the eight-day and 21-day exponential moving averages (EMAs) and the eight-day EMA is about to cross above the 21-day, both of which are bullish indicators. On Wednesday, the stock was able to pop up above the 50-day simple moving average as well, which indicates longer-term sentiment is now bullish.
Want direct analysis? Find me in the BZ Pro lounge! Click here for a free trial.
- Bulls want to see Alphabet trade sideways in consolidation to demonstrate stability or for the stock to drop and fill the gap, which could provide a solid entry to go long into the stock split. If either scenario plays out, the stock could be in for a blue sky run. Alphabet has resistance 2,992.10 and $3,037.
- Bears want to see big bearish volume knock Alphabet down into the gap and then for continued bearish moment to push the stock down below $2,494, which would indicate Wednesday’s move was a bull trap and the stock will continue in its downtrend. There is support below at $2,884.45 and $2,834.83.
Edge Rankings
Price Trend
© 2025 Benzinga.com. Benzinga does not provide investment advice. All rights reserved.
Trade confidently with insights and alerts from analyst ratings, free reports and breaking news that affects the stocks you care about.

