Block Inc. SQ shares are trading lower Thursday and have seen increasing volume as the price has been falling.
Shares have fallen below support and have been in a freefall in recent months. The stock has been trending on social media throughout the day.
Block was down 4.77% at $105.70 Thursday afternoon.
Block Daily Chart Analysis
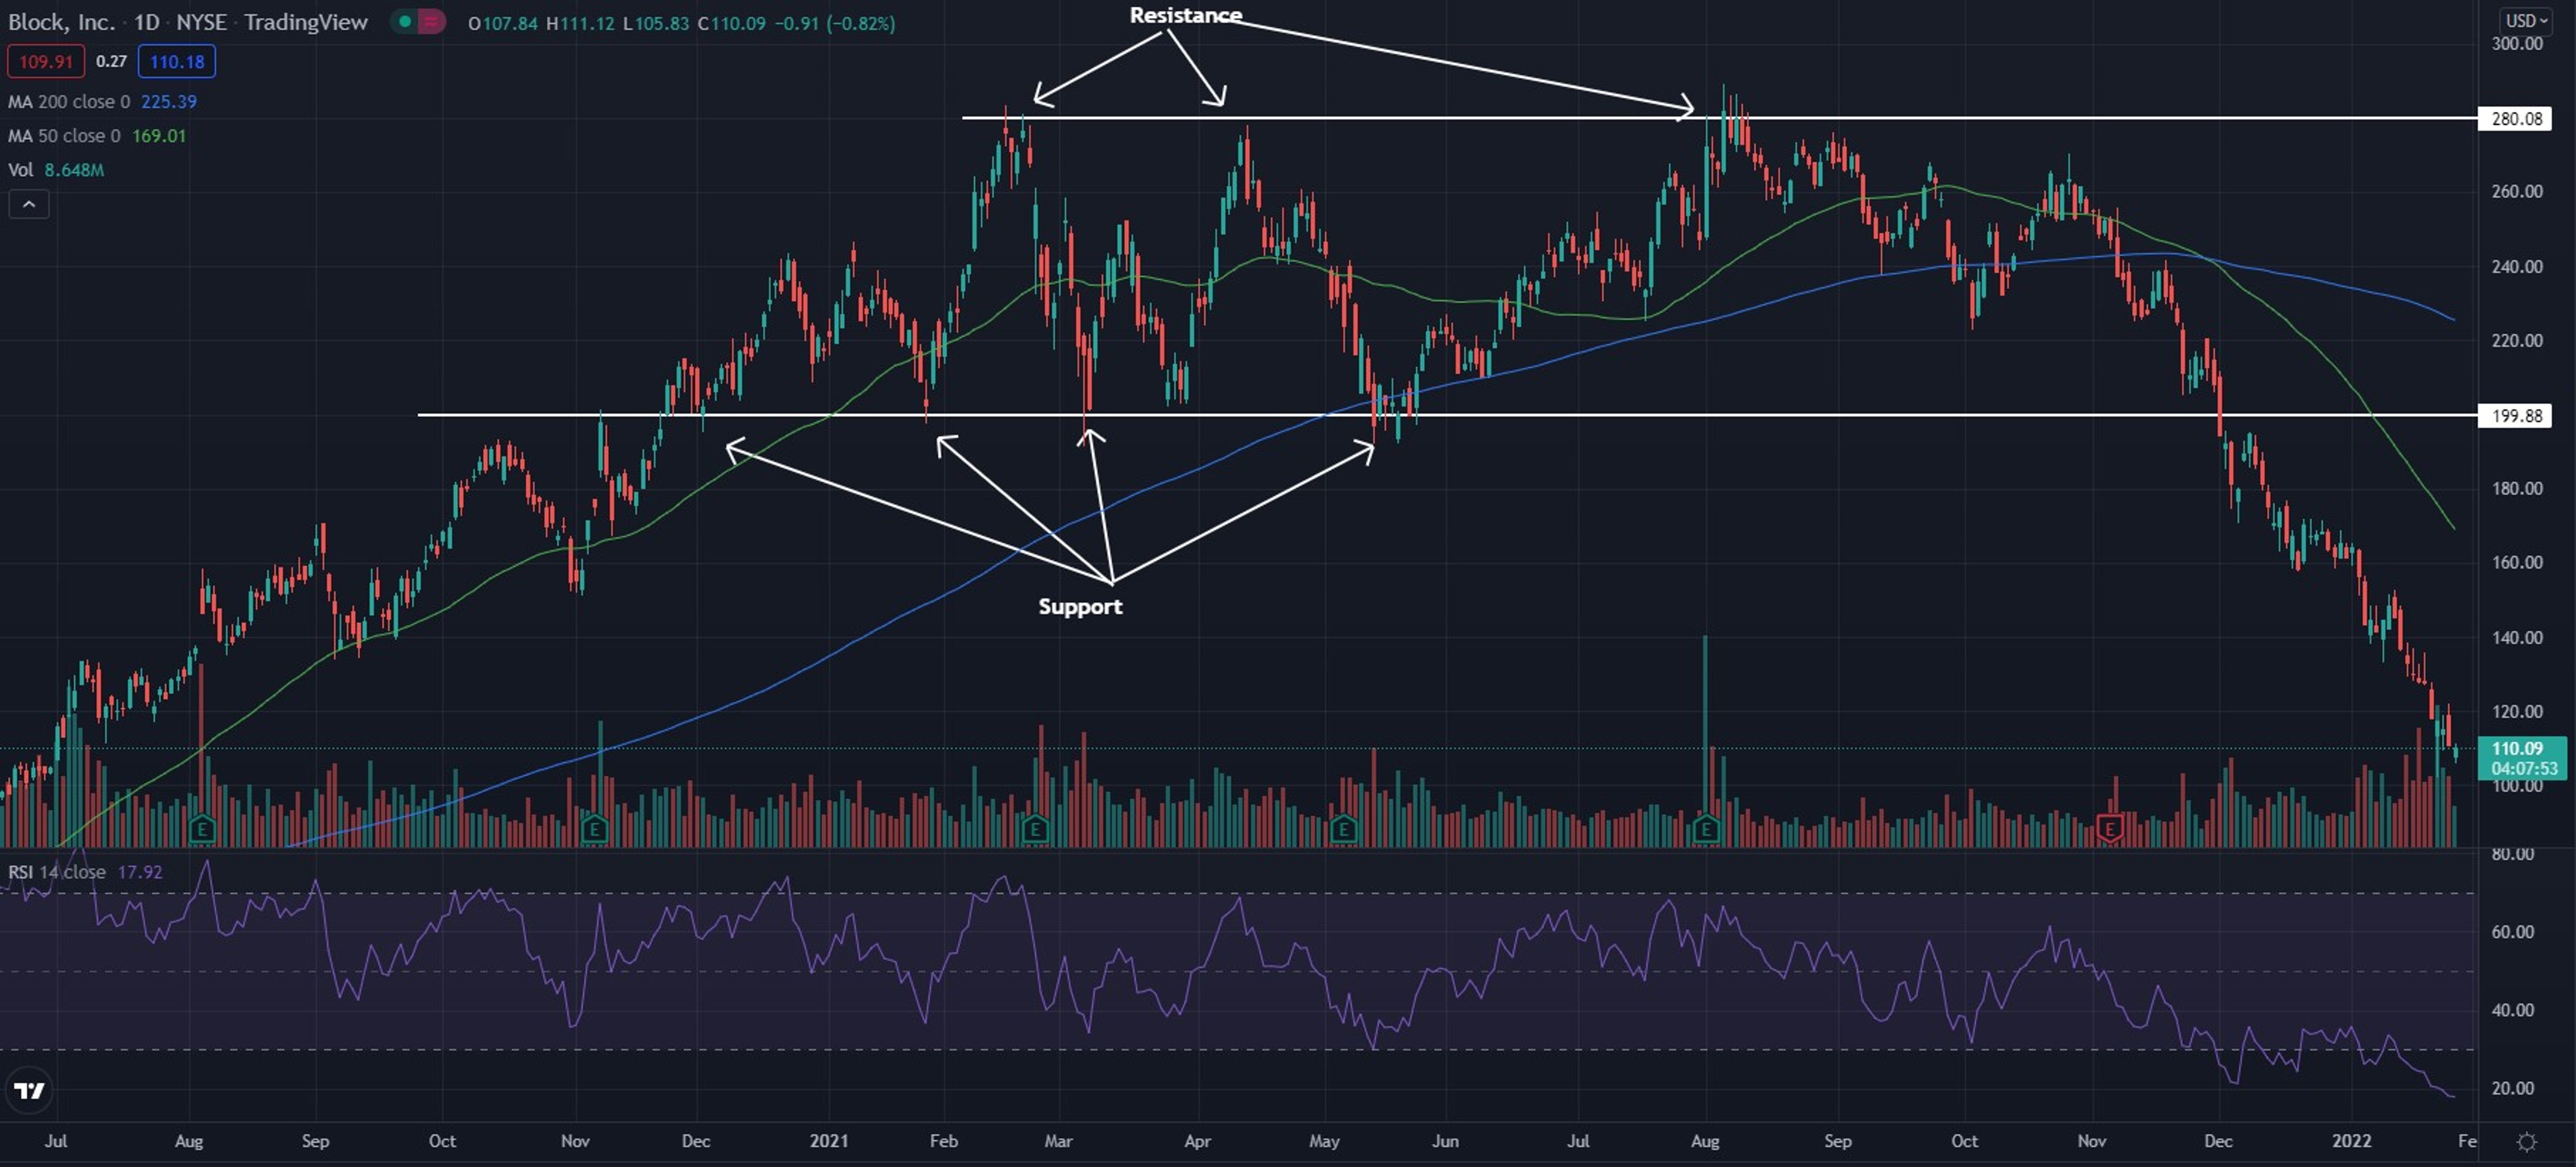
- The stock was trading in a sideways channel and cracked below the support level near the $200 level. Following the break below the level, the stock has been in a freefall lower. Volume has been increasing in the stock as it has been falling, hinting that the bearish trend is not yet over.
- The stock trades below both the 50-day moving average (green) and the 200-day moving average (blue). This indicates bearish sentiment, and each of these moving averages may hold as an area of resistance in the future.
- The Relative Strength Index (RSI) continues to fade lower as the stock falls and sits at 18. This shows the stock is heavily in the oversold region and looks to have no end in sight just yet. Price will most likely continue falling if the RSI stays oversold.

What’s Next For Block?
Block stock is in the middle of a bearish trend as it has been dumping lower. The stock needs to find an area where it finds support or it may continue the freefall. Bullish traders are looking to see a bounce and for the stock to begin to form higher lows and head back up toward the $200 level. Bearish traders want to see the stock continue to do what it is doing and continue to trend lower and hold below the moving averages.
Photo courtesy of Square.
© 2024 Benzinga.com. Benzinga does not provide investment advice. All rights reserved.
Trade confidently with insights and alerts from analyst ratings, free reports and breaking news that affects the stocks you care about.

