Advanced Micro Devices, Inc AMD and GameStop Corporation GME have created double bottom and triple bottom patterns on the daily chart.
A double bottom pattern is a reversal indicator that shows a stock has dropped to a key support level, rebounded, back tested the level as support and is likely to rebound again. It's possible the stock may retest the level as support again, creating a triple bottom or even quadruple bottom pattern.
The formation is always identified after a security has dropped in price and is at the bottom of a downtrend, whereas a bearish double top pattern is always found in an uptrend. A spike in volume confirms the double bottom pattern was recognized and subsequent increasing volume may indicate the stock will reverse into an uptrend.
- Aggressive bullish traders may choose to take a position when the stock’s volume spikes after the second retest of the support level. Conservative bullish traders may wait to take a position when the stock’s share price has surpassed the level of the initial rebound (the high before the second bounce from the support level).
- Bearish traders may choose to open a short position if the stock rejects at the level of the first rebound or if the stock falls beneath the key support level at which it created a double bottom pattern.
See Also: Wall Street Fund Managers Tracking Retail Traders On Social Media And Message Boards
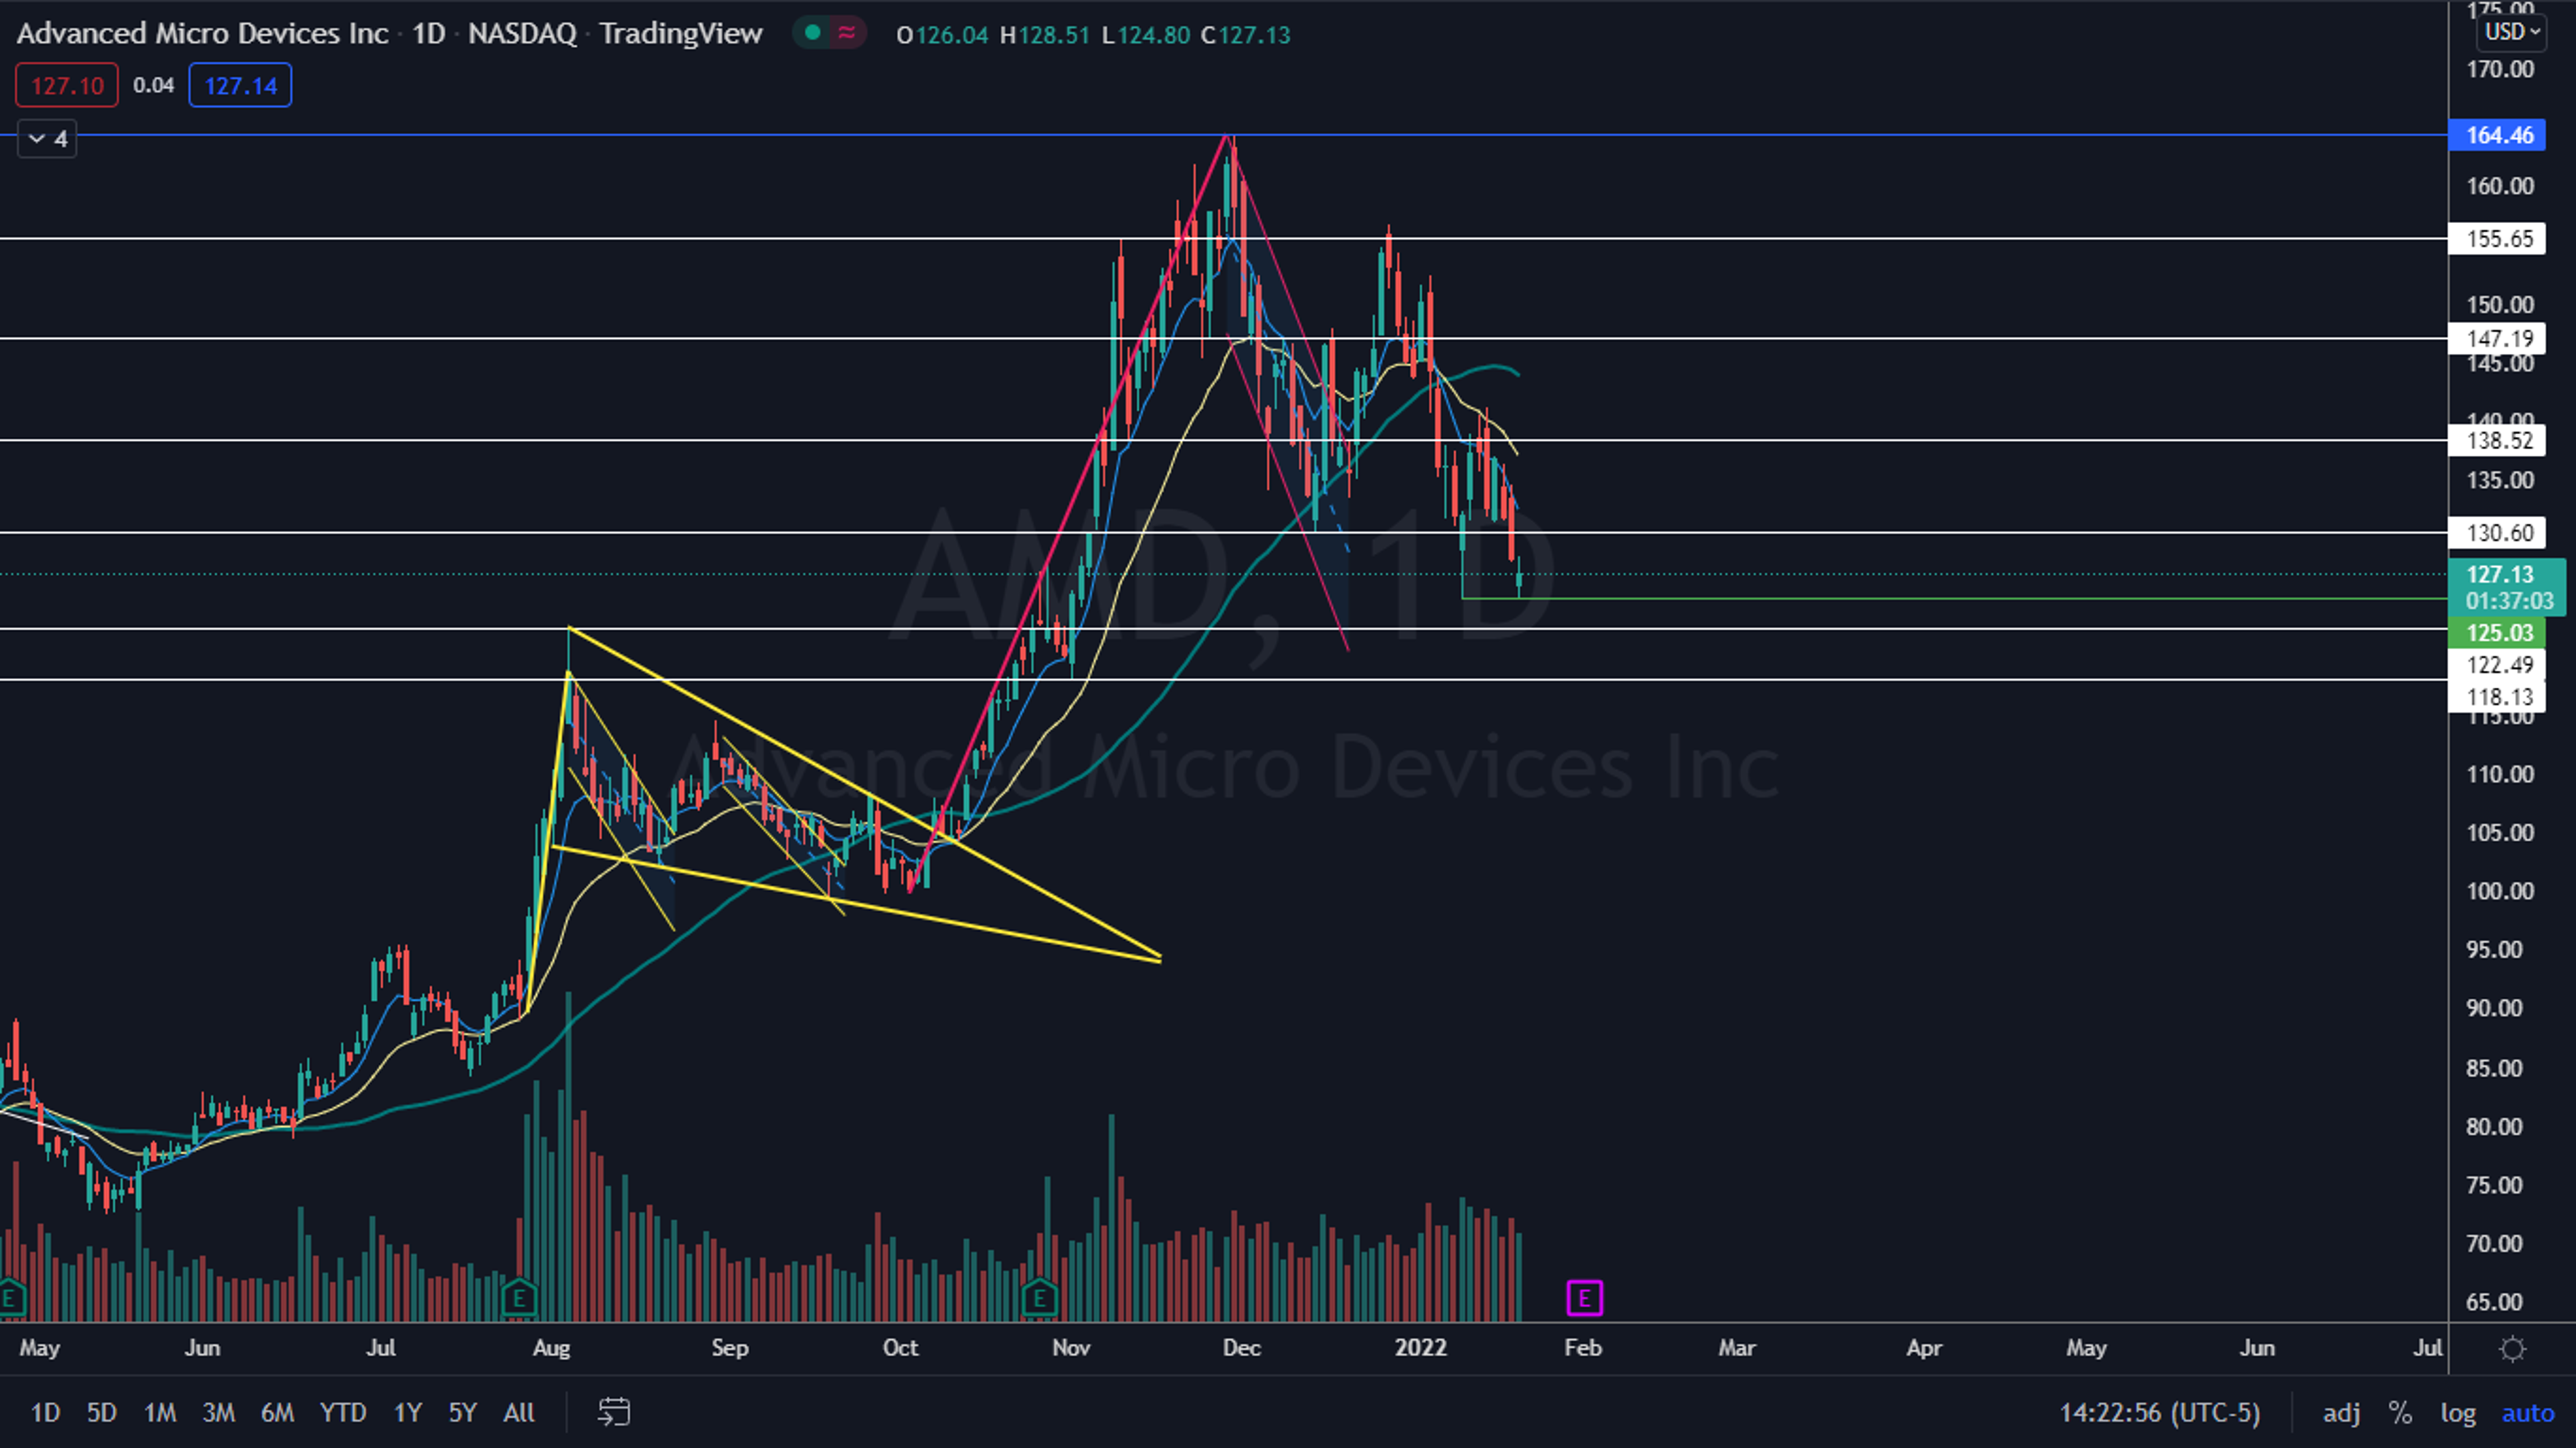
The Advanced Micro Devices Chart: On Thursday, AMD was printing a double bottom pattern at the $125.03 mark when combined with the price action at the level on Jan. 10.
- If the pattern is recognized, AMD should pop up over the following trading days to print a “W” pattern on the daily chart.
- If AMD closes the trading day near to its opening price, it will print a doji candlestick, which is found at the bottom of a trend and could indicate the stock will trade higher on Friday.
- AMD has resistance above at $130.60 and $138.52 and support below at $122.49 and $118.13.
Want direct analysis? Find me in the BZ Pro lounge! Click here for a free trial.

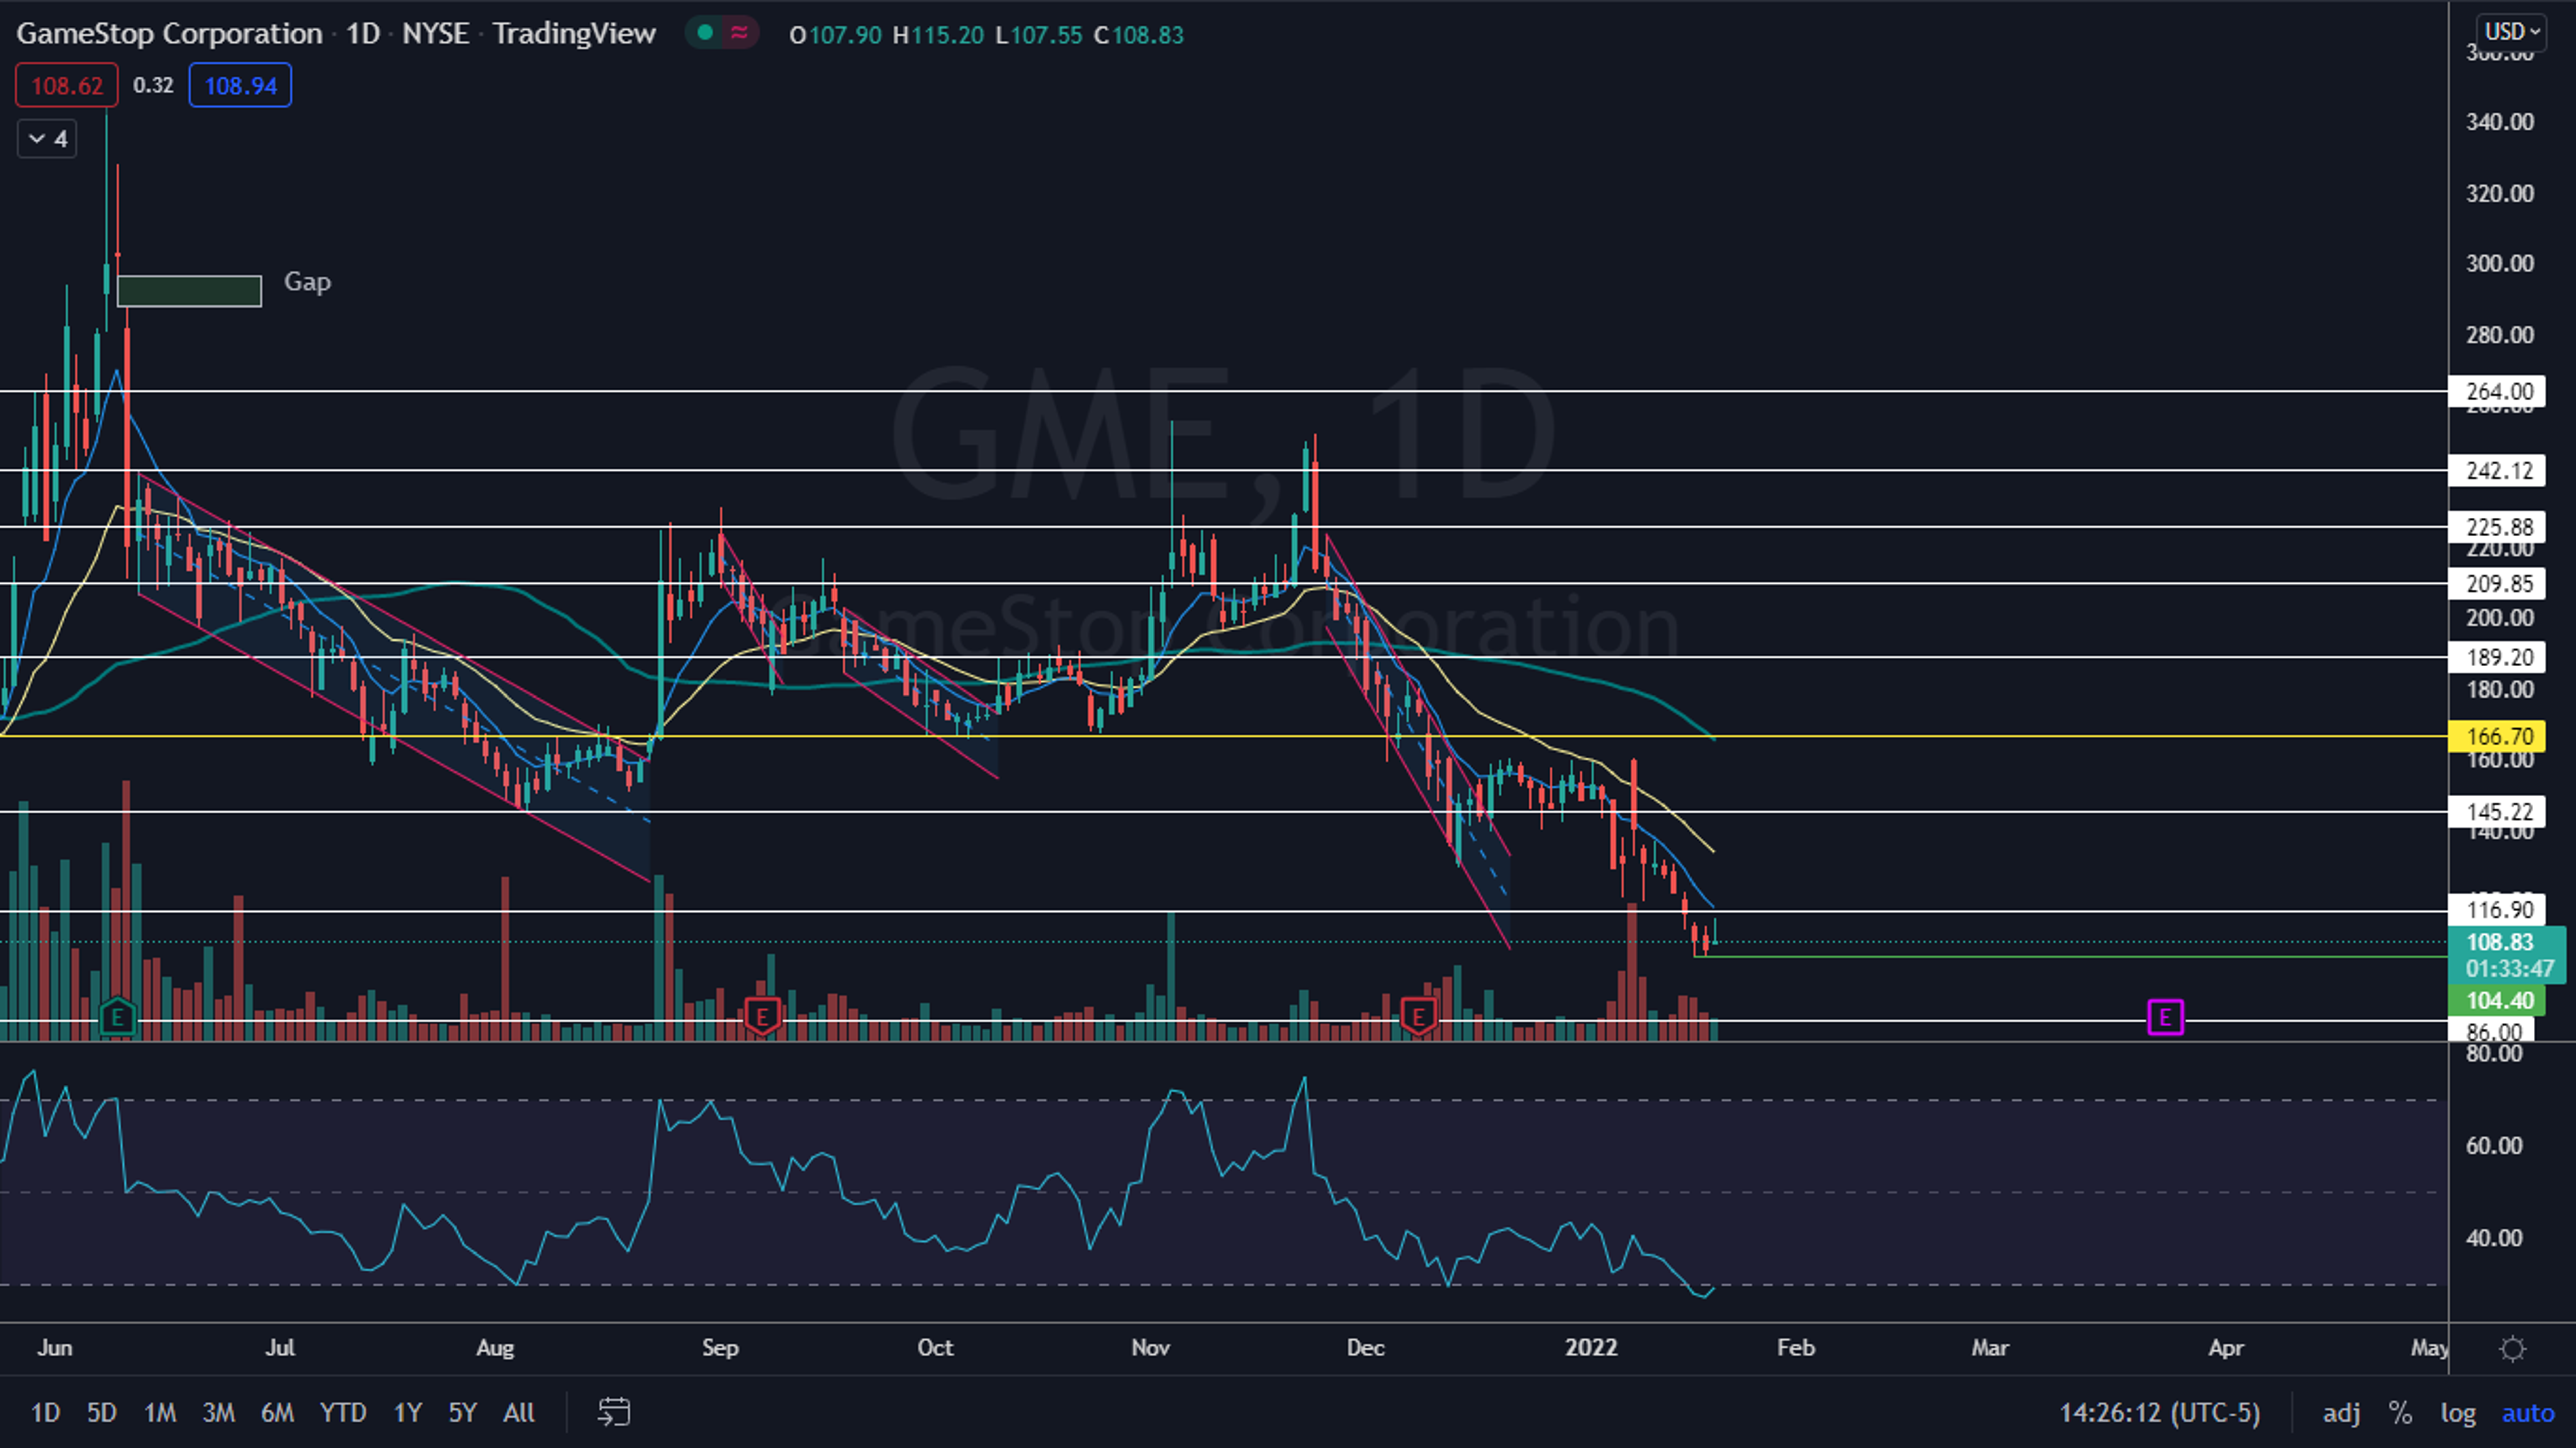
The GameStop Chart: GameStop printed a double bottom pattern on its daily chart on Tuesday and Wednesday, and on Thursday the stock attempted to break up from the formation but rejected near a resistance level at $116.
- GameStop’s relative strength index (RSI) is measuring low at 30%. When a stock’s RSI reaches or exceeds that level it becomes oversold, which can be a buy signal for technical traders.
- GameStop was trading on well below-average-volume on Thursday, which indicates the stock may be in a period of consolidation.
- GameStop has resistance above at $116.90 and $129.50 and support below at $99.97 and $86.
© 2024 Benzinga.com. Benzinga does not provide investment advice. All rights reserved.
Trade confidently with insights and alerts from analyst ratings, free reports and breaking news that affects the stocks you care about.

