


Apple Inc. AAPL and Walt Disney Co DIS have developed inside bar patterns on the daily chart. An inside bar pattern indicates a period of consolidation and is usually followed by a continuation move in the direction of the current trend.
An inside bar pattern has more validity on longer time frames, such as a four-hour chart. The pattern has a minimum of two candlesticks and consists of a mother bar (the first candlestick in the pattern) followed by one or more subsequent candles. The subsequent candle(s) must be completely inside the range of the mother bar and each is called an "inside bar."
A double or triple inside bar can be more powerful than a single inside bar. After the break of an inside bar pattern, traders want to watch for high volume for confirmation the pattern was recognized.
- Bullish traders will want to search for inside bar patterns on stocks that are in an uptrend. Some traders may take a position during the inside bar prior to the break while other aggressive traders will take a position after the break of the pattern.
- For bearish traders, finding an inside bar pattern on a stock that's in a downtrend will be key. Like bullish traders, bears have two options of where to take a position to play the break of the pattern. For bearish traders, the pattern is invalidated if the stock rises above the highest range of the mother candle.
See Also: Disney Creates Hub Focused On International Content Creation
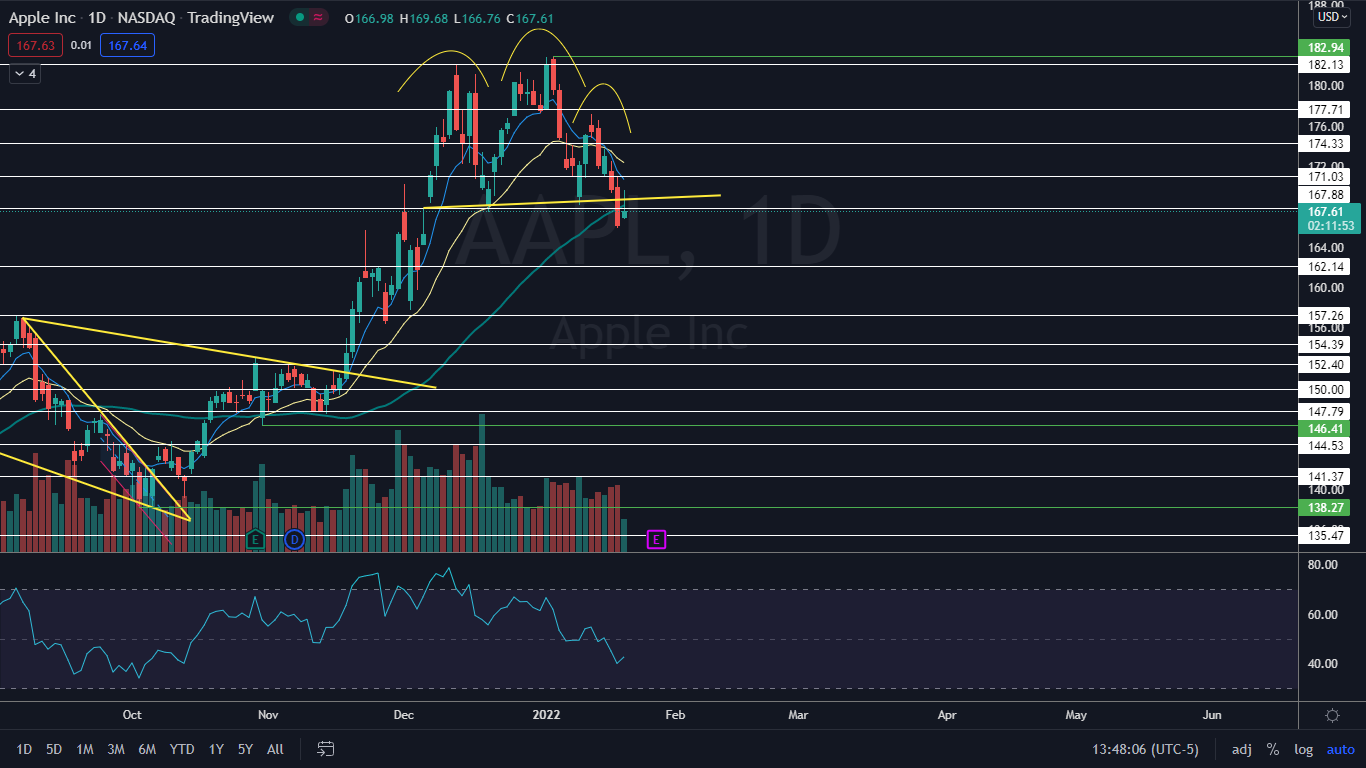
The Apple Chart: On Wednesday, Apple stock broke down from a bearish head-and-shoulders pattern Benzinga called out on Tuesday. On Thursday, the stock was consolidating the move lower by printing an inside bar.
- The inside bar was being printed on low volume, which confirms consolidation.
- On Thursday, Apple attempted to regain the 50-day simple moving average as support and failed, which indicates longer-term sentiment is bearish.
- The inside bar pattern leans bearish because the stock was trading lower before forming it but traders can watch for a break of the pattern on Friday to gauge the future direction.
- Apple has resistance above at $167.88 and $171.03 and support below at $162.14 and $157.26.
Want direct analysis? Find me in the BZ Pro lounge! Click here for a free trial.
The Disney Chart: Disney was printing a double inside bar on Thursday, with the first inside bar printed Wednesday and the mother bar on Tuesday. Disney has been consolidating its Jan. 14 move lower where the stock gapped down about 2%.
- Disney is likely to trade back up to fill the range of the gap in the future because gaps on charts fill about 90% of the time. Disney’s gap is between $152.06 and $155.17. The stock has another higher gap as well between anout $163 and $173.
- Like Apple’s stock, Disney’s double inside bar pattern leans bearish and the long upper wicks on Wednesday and Thursday’s candle indicate there are sellers above $151.
- Disney has resistance above at $153.88 and $160.90 and support below at $147.85 and $141.70.
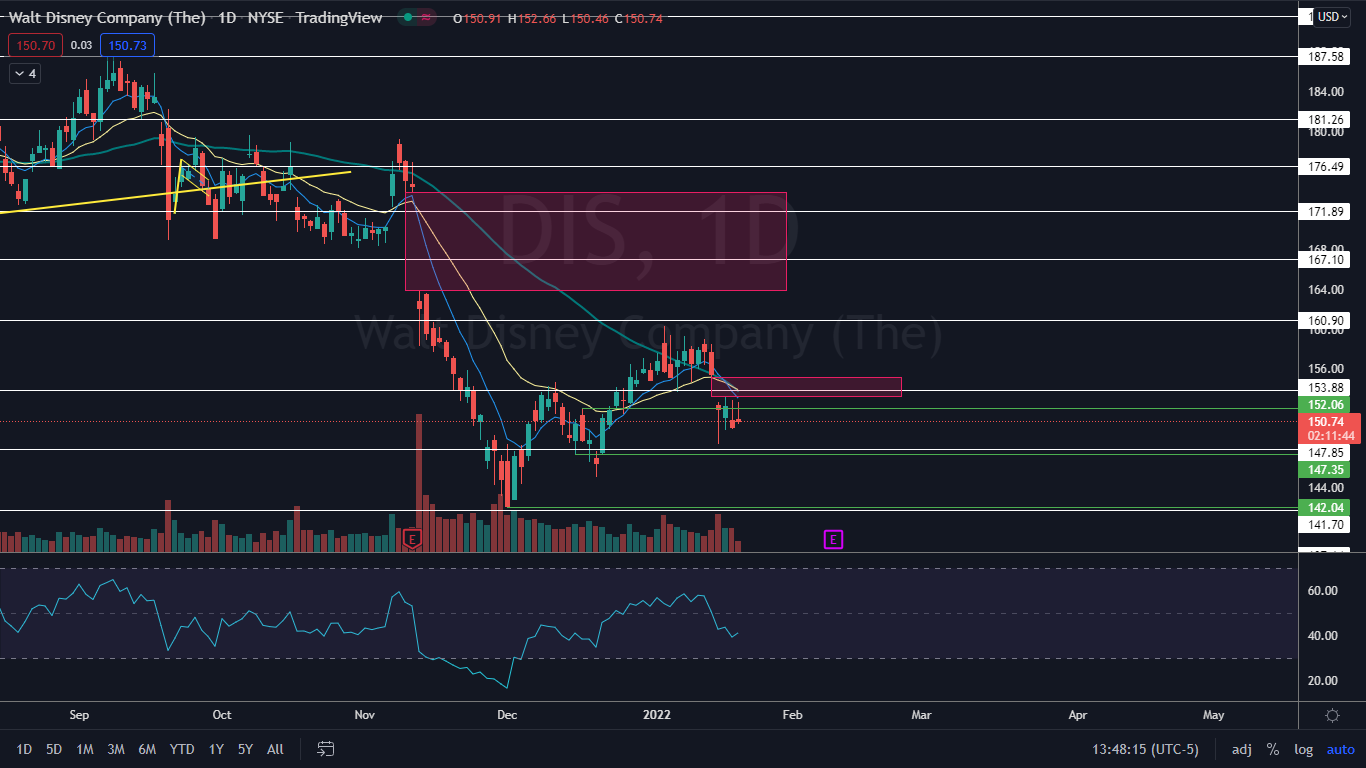
Photo: LendingMemo.com
Edge Rankings
Price Trend
© 2025 Benzinga.com. Benzinga does not provide investment advice. All rights reserved.
Trade confidently with insights and alerts from analyst ratings, free reports and breaking news that affects the stocks you care about.

